
IMPACT OF GLOBAL TRADE AGREEMENTS ON THE AUTO INDUSTRY AND ITS SUPPLY CHAIN – TERMINATING NAFTA
Impact of terminating NAFTA on the auto industry – specifically Magna International
Impact of global trade agreements on the auto industry and its supply chain – terminating nafta

shokouh shafiei
2019 MBA Candidate
Harvard Business School
Essay Word Count: 771 (does not include cover page or Exhibits)
Isolationism and International Trade
There are hardly any complex consumer products in the market that are truly made in one region. The auto industry is no exception. Even the TESLA Model S and X, the only vehicles claiming 100% assembly in the U.S., use outside suppliers for components such as the Canadian Auto Parts supplier, Magna International and Mexican Lithium miners Bacanora Minerals. 5
Global trade may date back as far as the silk road or perhaps prior, but more structured trade agreements have been put in place in the 20th century between 2 or more regions allowing for import and export of goods to provide consumers with broader product options and at times lower prices. One of these key agreements was put in place in January of 1994 between the three North American nations, Canada, United States and Mexico. The agreement is known as NAFTA (The North American Free Trade Agreement).
NAFTA
The United States commenced bilateral trade negotiations with Canada more than 30 years ago, resulting in the U.S.-Canada Free Trade Agreement, which entered into force on January 1, 1989. In 1991, bilateral talks began with Mexico, which Canada joined. The NAFTA followed, entering into force on January 1, 1994. Tariffs were eliminated progressively and all duties and quantitative restrictions, with the exception of those on a limited number of agricultural products traded with Canada, were eliminated by 2008. 6
Starting in 2015, NAFTA became a household name as it was a key topic in the center of then, Republican presidential candidate and current U.S. president, Donald Trump. His beliefs are that NAFTA has brought more harm to the U.S. economy than benefit and should be terminated. The key reason being the loss of manufacturing jobs in U.S. as many automotive companies have moved operations outside of U.S. under this agreement.1
Many industry leaders however believe that NAFTA, though not perfect, has been a key contributor the growth of trade in U.S. over the span of its quarter of a century existence and demolishing it without considering all the consequences will cause significant harm to the auto industry and the U.S. economy as a whole. This is a view shared not only by key automakers in the U.S. (i.e. Ford, GM, Toyota, etc.), but also the sector’s key suppliers, such as Magna International. 2,3,4 (Exhibit 7)
Magna International Inc.
Magna, a Canadian company, is a leading global automotive supplier with 328 manufacturing operations and 99 product development, engineering and sales centers in 29 countries employing over 163,000 individuals, of which, 160 facilities and over 75000 employees work in the NAFTA region (Exhibit 1). Magna is positioned in the middle of the overall auto industry supply chain as it needs to source parts and supply parts to companies within the NAFTA region. 7
One of the key strategic factors contributing to Magna’s growth and success in the industry has been its agility and flexibility to serve its customers. Their manufacturing sites are often within close proximity of their key suppliers and as a result, they have expanded beyond Canada and have opened many facilities in US & Mexico to serve customers in those regions (i.e. BMW in SC, GM & potentially BMW in San Luis Potosi, MX). 8
Impact of demolishing NAFTA
Due to the existence of NAFTA, automakers have been able to leverage the lowest parts and labor cost in manufacturing and providing the consumer with the most value for the product. If NAFTA was to demolish and high tariffs were to be added to products imported to the U.S. from Mexico and Canada, the exports would take a hit as well. For example, Magna announced in December of 2016 that it had won BMW’s business for seating products in South Carolina and they plan on opening a 4th manufacturing location in that state employing up to 480 people. 7
Magna also has facilities in Mexico which will likely supply the BMW facility in San Luis Potosi, MX. 8 U.S. will import BMW 300 series from Mexico while exporting BMW SUV’s produced in South Carolina to Mexico and Canada. In the short to medium term, Magna will continue operations as is and if tariffs are risen, they will have to pass the cost on to the consumers as moving numerous facilities will result in massive capital expenditure and will not be feasible.
My recommendation would be for Magna to actively work with the auto industry in North America to use their collective voice and work with law makers at the state level to ensure the agreement is improved rather than terminated as it will be the only win-win situation.
Historical trade data from the United States Census Bureau shows the direct correlation between Import & Export and is kept by country on a monthly basis. Tables and graphs in Exhibits 2 through 6 capture this data since 1990. 9 Arguably reducing import from NAFTA regions will not yield higher jobs in the U.S. and eventually higher exports.
Exhibit 1 Magna’s Facility & Employee Distribution in NA
| Headquarter | Manufacturing / Assembly | Engineering / Sales / Product Development | Employees | ||
| CANADA | 1 | 50 | 11 | 21575 | |
| UNITED STATES | 1 | 58 | 13 | 24900 | |
| MEXICO | 0 | 31 | 1 | 29125 |
Source: Company Website
Exhibit 2 US Historical Import Export – Global
| TABLE 1: US Global Trade Value ($ millions USD) | |||
| YEAR | EXPORTS | IMPORTS | BALANCE |
| 2016 | 1,451,011 | 2,187,805 | (736,794) |
| 2015 | 1,503,102 | 2,248,183 | (745,082) |
| 2014 | 1,621,874 | 2,356,356 | (734,482) |
| 2013 | 1,578,517 | 2,267,987 | (689,470) |
| 2012 | 1,545,821 | 2,276,267 | (730,446) |
| 2011 | 1,482,508 | 2,207,954 | (725,447) |
| 2010 | 1,278,495 | 1,913,857 | (635,362) |
| 2009 | 1,056,043 | 1,559,625 | (503,582) |
| 2008 | 1,287,442 | 2,103,641 | (816,199) |
| 2007 | 1,148,199 | 1,956,961 | (808,762) |
| 2006 | 1,025,968 | 1,853,938 | (827,971) |
| 2005 | 901,082 | 1,673,454 | (772,372) |
| 2004 | 814,875 | 1,469,705 | (654,830) |
| 2003 | 724,771 | 1,257,121 | (532,350) |
| 2002 | 693,101 | 1,161,366 | (468,265) |
| 2001 | 729,101 | 1,140,998 | (411,898) |
| 2000 | 781,918 | 1,218,023 | (436,105) |
| 1999 | 695,797 | 1,024,616 | (328,819) |
| 1998 | 682,139 | 911,897 | (229,758) |
| 1997 | 689,180 | 869,703 | (180,523) |
| 1996 | 625,073 | 795,287 | (170,213) |
| 1995 | 584,740 | 743,545 | (158,805) |
| 1994 | 512,625 | 663,252 | (150,627) |
| 1993 | 465,090 | 580,656 | (115,566) |
| 1992 | 448,165 | 532,662 | (84,497) |
| 1991 | 421,730 | 488,453 | (66,723) |
| 1990 | 393,592 | 495,311 | (101,718) |
| AVERAGE | 931,184 | 1,405,875 | (474,691) |
| Source: United States Census Bureau – Foreign Trades | |||
| Note: Figures are not seasonally adjusted | |||
Exhibit 3 US Historical Import Export – Mexico
| TABLE 2: US Trade Value w/Mexico ($ millions USD) | |||
| YEAR | EXPORTS | IMPORTS | BALANCE |
| 2016 | 229,702 | 294,056 | (64,354) |
| 2015 | 236,204 | 296,401 | (60,197) |
| 2014 | 241,007 | 295,730 | (54,723) |
| 2013 | 225,954 | 280,556 | (54,602) |
| 2012 | 215,875 | 277,594 | (61,719) |
| 2011 | 198,289 | 262,874 | (64,585) |
| 2010 | 163,665 | 229,986 | (66,321) |
| 2009 | 128,892 | 176,654 | (47,762) |
| 2008 | 151,220 | 215,942 | (64,722) |
| 2007 | 135,918 | 210,714 | (74,796) |
| 2006 | 133,722 | 198,253 | (64,531) |
| 2005 | 120,248 | 170,109 | (49,861) |
| 2004 | 110,731 | 155,902 | (45,170) |
| 2003 | 97,412 | 138,060 | (40,648) |
| 2002 | 97,470 | 134,616 | (37,146) |
| 2001 | 101,297 | 131,338 | (30,041) |
| 2000 | 111,349 | 135,926 | (24,577) |
| 1999 | 86,909 | 109,721 | (22,812) |
| 1998 | 78,773 | 94,629 | (15,856) |
| 1997 | 71,389 | 85,938 | (14,549) |
| 1996 | 56,792 | 74,297 | (17,506) |
| 1995 | 46,292 | 62,100 | (15,808) |
| 1994 | 50,844 | 49,494 | 1,350 |
| 1993 | 41,581 | 39,918 | 1,663 |
| 1992 | 40,592 | 35,211 | 5,381 |
| 1991 | 33,277 | 31,130 | 2,148 |
| 1990 | 28,279 | 30,157 | (1,878) |
| AVERAGE | 119,766 | 156,196 | (36,430) |
| Source: United States Census Bureau – Foreign Trades | |
| Note: Figures are not seasonally adjusted | |
Exhibit 4 US Historical Import Export – Canada
| TABLE 3: US Trade Value w/Canada ($ millions USD) | |||
| YEAR | EXPORTS | IMPORTS | BALANCE |
| 2016 | 266,797 | 277,756 | (10,958) |
| 2015 | 280,855 | 296,231 | (15,375) |
| 2014 | 312,817 | 349,286 | (36,469) |
| 2013 | 300,755 | 332,504 | (31,749) |
| 2012 | 292,651 | 324,263 | (31,613) |
| 2011 | 281,292 | 315,325 | (34,033) |
| 2010 | 249,257 | 277,637 | (28,380) |
| 2009 | 204,658 | 226,248 | (21,591) |
| 2008 | 261,150 | 339,491 | (78,342) |
| 2007 | 248,888 | 317,057 | (68,169) |
| 2006 | 230,656 | 302,438 | (71,782) |
| 2005 | 211,899 | 290,384 | (78,486) |
| 2004 | 189,880 | 256,360 | (66,480) |
| 2003 | 169,924 | 221,595 | (51,671) |
| 2002 | 160,923 | 209,088 | (48,165) |
| 2001 | 163,424 | 216,268 | (52,844) |
| 2000 | 178,941 | 230,838 | (51,897) |
| 1999 | 166,600 | 198,711 | (32,111) |
| 1998 | 156,604 | 173,256 | (16,653) |
| 1997 | 151,767 | 167,234 | (15,467) |
| 1996 | 134,210 | 155,893 | (21,682) |
| 1995 | 127,226 | 144,370 | (17,144) |
| 1994 | 114,439 | 128,406 | (13,967) |
| 1993 | 100,444 | 111,216 | (10,772) |
| 1992 | 90,594 | 98,630 | (8,036) |
| 1991 | 85,150 | 91,064 | (5,914) |
| 1990 | 83,674 | 91,380 | (7,706) |
| AVERAGE | 193,166 | 227,516 | (34,350) |
| Source: United States Census Bureau – Foreign Trades | |
| Note: Figures are not seasonally adjusted | |
Exhibit 5 US Historical Import Export – NAFTA Region
| TABLE 4: NAFTA Trade Value ($ millions USD) | |||||
| YEAR | EXPORTS | IMPORTS | BALANCE | EXPORT % GLOBAL | IMPORT % GLOBAL |
| 2016 | 496,499 | 571,812 | (75,312) | 34% | 26% |
| 2015 | 517,059 | 592,632 | (75,572) | 34% | 26% |
| 2014 | 553,824 | 645,016 | (91,192) | 34% | 27% |
| 2013 | 526,709 | 613,060 | (86,351) | 33% | 27% |
| 2012 | 508,526 | 601,857 | (93,331) | 33% | 26% |
| 2011 | 479,580 | 578,198 | (98,618) | 32% | 26% |
| 2010 | 412,921 | 507,622 | (94,701) | 32% | 27% |
| 2009 | 333,550 | 402,903 | (69,353) | 32% | 26% |
| 2008 | 412,370 | 555,433 | (143,063) | 32% | 26% |
| 2007 | 384,806 | 527,771 | (142,964) | 34% | 27% |
| 2006 | 364,378 | 500,691 | (136,313) | 36% | 27% |
| 2005 | 332,146 | 460,493 | (128,347) | 37% | 28% |
| 2004 | 300,611 | 412,261 | (111,650) | 37% | 28% |
| 2003 | 267,336 | 359,655 | (92,319) | 37% | 29% |
| 2002 | 258,393 | 343,704 | (85,311) | 37% | 30% |
| 2001 | 264,721 | 347,606 | (82,885) | 36% | 30% |
| 2000 | 290,290 | 366,765 | (76,475) | 37% | 30% |
| 1999 | 253,509 | 308,432 | (54,923) | 36% | 30% |
| 1998 | 235,376 | 267,885 | (32,509) | 35% | 29% |
| 1997 | 223,155 | 253,172 | (30,017) | 32% | 29% |
| 1996 | 191,002 | 230,190 | (39,188) | 31% | 29% |
| 1995 | 173,518 | 206,470 | (32,952) | 30% | 28% |
| 1994 | 165,282 | 177,900 | (12,618) | 32% | 27% |
| 1993 | 142,025 | 151,134 | (9,109) | 31% | 26% |
| 1992 | 131,187 | 133,841 | (2,654) | 29% | 25% |
| 1991 | 118,427 | 122,194 | (3,767) | 28% | 25% |
| 1990 | 111,953 | 121,537 | (9,584) | 28% | 25% |
| AVERAGE | 312,932 | 383,712 | (70,781) | 33% | 27% |
| Source: United States Census Bureau – Foreign Trades | |
| Note: Figures are not seasonally adjusted | |
Exhibit 6 U.S. Import/Export Trends
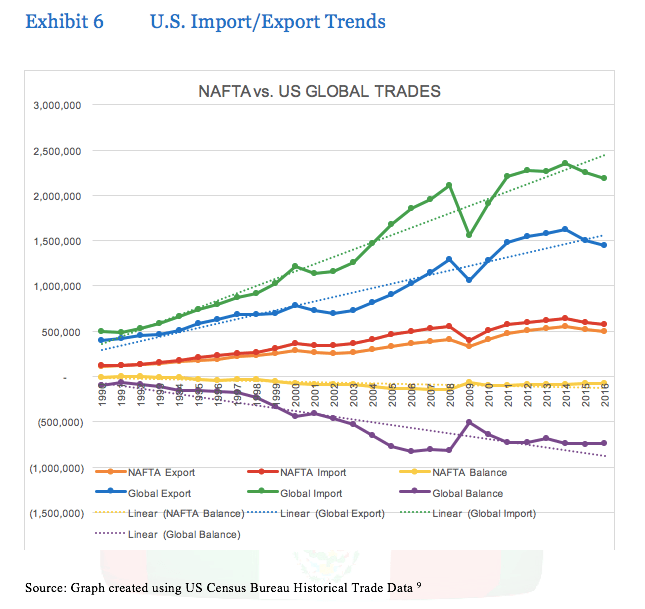
Source: Graph created using US Census Bureau Historical Trade Data 9
Exhibit 6 (Cont.) U.S. Import/Export Trends
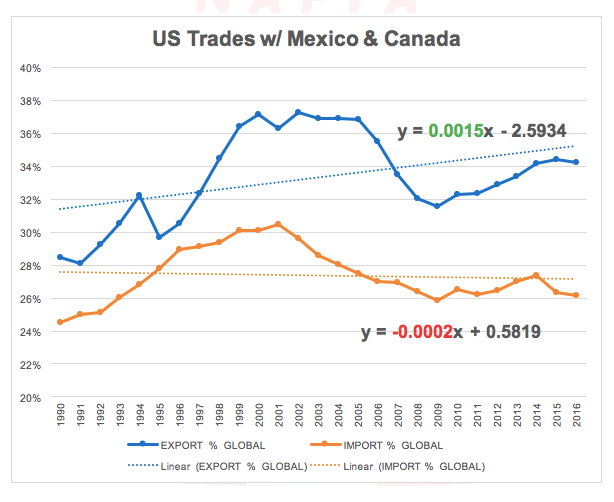
Exhibit 7 U.S. President & Auto Industry Leaders’ view on NAFTA
“The worst trade deal ever made” Donald J Trump – US President 1
“NAFTA agreement has made the overall sector much more competitive on a global basis” Bob Shanks – CFO Ford Motor Co. 2
“NAFTA has been around a long time, and it probably needs to be modernized, but it has been positive overall for America” Jim Lentz – CEO Toyota Motor NA 3
“I think anybody that is contemplating any big investment over the long term is probably either waiting or going to be biased to invest more in the U.S. until there is an outcome here” Don Walker – CEO Magna International 4
Endnotes & References
1 The Washington Post – https://www.washingtonpost.com/business/economy/trump-twitter-bombs-and-a-negotiating-standoff-how-nafta-talks-could-fail/2017/10/06/96b25f68-a91b-11e7-850e-2bdd1236be5d_story.html?utm_term=.02674aa642a8
3 The Detroit News http://www.detroitnews.com/story/business/autos/foreign/2017/05/04/toyota-lentz-nafta/101300988/
4 CNBC – Mad Money with Jim Cramer https://www.youtube.com/watch?v=BLwOdl3p7qE
5 Times.com http://time.com/4677817/american-cars-brands-manufacturing/
5 Investopedia https://www.investopedia.com/ask/answers/052815/who-are-teslas-tsla-main-suppliers.asp
6 Office of the United States Trade Representative https://ustr.gov/trade-agreements/free-trade-agreements/north-american-free-trade-agreement-nafta
7 Magna International Inc. http://www.magna.com/about-magna
7 Magna International Inc. http://www.magna.com/media/press-releases-news/releases-news/2016/12/06/magna-secures-new-seat-business
8 Auto News http://www.autonews.com/article/20160801/OEM10/160729860/in-mexico-bmw-builds-supply-base-from-scratch
9 United States Census Bureau https://www.census.gov/foreign-trade/balance/index.html
Tables and graphs in the Exhibits 2 through 6 were generated using the annual trade figures reported by the US Census Bureau
Your article points out the critical role of auto industry lobbyists in Washington, but it makes me wonder exactly how companies like Ford and GM, let alone Magna, will influence a president that seems dead-set on ending NAFTA. What is the risk that OEMs switch to domestic suppliers only, or even seek to vertically integrate their supply chain? Your description of Magna as flexible and agile makes me think they’re better positioned than most companies to face the end of NAFTA. It sounds like they may be able to shift production of U.S.-destined parts to its existing U.S.-based plants, so they may be able to avoid new tariffs. I’d be curious to know if this is feasible for other OEM suppliers.
This feels as if it is a collective problem for the entire auto industry and I wonder if because of that OEMs may just continue business as usual even if NAFTA were to fall through and tariffs were imposed. If OEMs are just able to collectively pass the tariffs onto consumers, their price differential to consumers will remain the same as today and performance relative to other car brands should continue as normal. However, there may be less demand for cars at this higher price point especially with a greater influx of ride sharing platforms and additional talks of infrastructure investments.
Your argument clearly highlights the benefits of NAFTA to consumers, who will bear the ultimate cost of its removal. Magna seems well-positioned to weather the storm if NAFTA is removed since they already have production capabilities in all of their customers’ markets and proximity to their customers generates an advantage. I am more concerned for smaller players without this network in place, who will also struggle to be heard in Washington.
I share the same concern and if the big players don’t stop the change, it will certainly force many of the small players out of the business and the implications of that will be grand at a cumulative level. I read many articles on the topic of NAFTA and each highlighted a different risk and collectively, it is clear this is a critical enough topic to be discussed at a greater level by those who either have the power or ability to influence law makers. Appreciate the feedback.
Reading your great article makes me question why policymakers may have forgotten the benefits of international trade as we have learned in FIN class. It raised a question to me that “To what extent does a single country should be self-sustained or should it instead be focusing on one area that it is best at while relying on others to provide them with other goods?”. In my opinion, although demolishing NAFTA may seem to benefits, domestic manufacturers, but these companies now have fewer incentives to become more innovative and efficient. As a result, the end consumers are the one paying the price for this policy as the increased cost will be passed on.