
Big Data for Music Festivals
Using insights gathered from data to improve the design, planning and sustainability efforts of future festivals
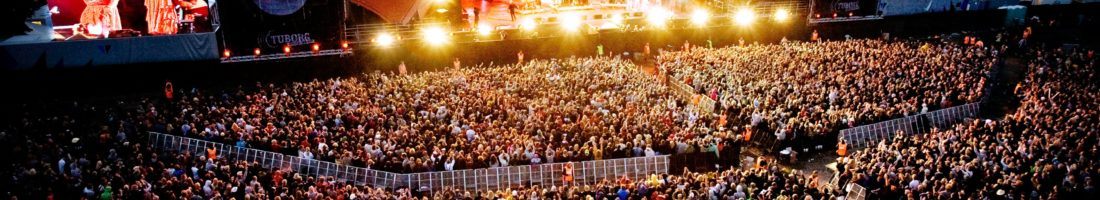
The Roskilde Festival is the largest culture and music festival in Northern Europe, attracting over 130,000 visitors annually (2015). Over the ten day festival, more than 170 live music and cultural acts perform and festival-goers consumes over 200 tons of food and generates over 300 tons of waste.
 In 2015, Copenhagen Business School partnered with IBM to create a big data laboratory during the Roskilde Festival. They wanted to use the festival as test bed for research into sustainability efforts and issues of urban environments. The festival was chosen to as it was seen as a microcosm of a complex modern city. The goal was to gather data in this real-world laboratory to devise and test initiatives to improve sustainability efforts.
For the festival producer, gathering this data and insights can help improve the sustainability of the festival and provide potential cost reduction benefits. On the revenue side, the insights could lead to better attendee experiences and drive more returning consumers: reducing churn and thereby increasing the lifetime value of festival-goers.

The project team collected a massive amount of data during the 2015 festival, amounting to over 91 million tracking points. These were unstructured data, primarily collected from festival-goers’ smartphones through an opt-in program. Examples of metrics captured are: movement of crowds through the event, sales of food and beverages over time, popularity of different musical acts, weather data. They also conducted over 12,000 interviews with festival attendees. The team used cloud-based analytics, which was much faster to set up, manage and eventually scale.
These collected data was used to investigate relationships and interesting correlations between these metrics. Some of the questions asked were:
- Relationship between unique users and total minutes watched of event X
- How many people visited each concert and how long they stayed there
- Which concerts were watched by the same people
- Which food courts and bars were most popular
- How many people shopped outside of the site during the festival
The team used this data to help construct the flow of how people travel in the site over time to enhance planning and designing a safer and better experience for festival-goers. They found trends of food sales with respect to temperature and time of day to help merchants strategize and plan their inventory, contributing to reduced waste and added profitability. This data was also used to gather insights into personality types of consumers. An ongoing project is underway to uncover and understand behavior insights of people who watch certain combination of artists, like what type of food or brands they may prefer. These data could also help the festival producer better understand factors that lead to customer churn, customize and boost their marketing efforts to the different consumer types to drive revenues.

Looking forward, the festival producers hope to develop predictive models for these patterns and trends. The aim for the following year’s festival is to execute on real-time analytics during the festival, producing live updates and recommendations for participants to enhance their festival experience and to alleviate congestion and risk of accidents. They aim to provide live information such as how crowded each concert is, lines for food outlets and bathrooms to help with crowd control. The longer term goal of these efforts is to use insights gathered from data across multiple years to improve the design, planning and sustainability efforts of future festivals.
Sources:
https://channels.theinnovationenterprise.com/articles/predictive-modeling-around-music-festivals
Hi Ophelia! As usual, very well-written and well done. 🙂 This is all very interesting, but I must admit – and pardon me for my frankness – that your post leaves a big cliff hanger: what were the results from the Copenhagen Business School-IBM big data laboratory?
I’m curious as to how much value was created from the big data laboratory. I can certainly see cost-savings resulting from the use of big data and analytics at the Roskilde Festival, but aside from that (cost-savings) what other value is created pertaining to “sustainability efforts”? Indeed, an argument can be made that reducing waste is one form of “value” being created, but how much does this matter? A lot of waste at concerts is probably generated by food items, but what matters more for convert venues, burrito wrappers or dollars created from selling wrapped burritos?
The big data laboratory was created in 2015. What changes were made to the festival due to the use of big data in 2016? How did data analytics improve the user experience at Roskilde?
Looking forward to hearing your thoughts! Again, good job!